Snowflake Resource Monitors for Engineering Teams
Set spending limits on warehouses before runaway costs become visible in your bill.

Snowflake sells elasticity as a feature, and it is one. Warehouses spin up on demand, scale out under load, and shut down when idle, all without a human approving each step. So the ceiling that older, fixed-capacity systems imposed by default is gone. Nothing in the platform stops a warehouse from running at a larger size than it needs, or from staying up long after the job that justified it has finished. A warehouse sized one notch too large, a query that never should have run at that scale, or a session someone forgot to close all bleed credits quietly, with no error thrown and no alert raised on their own.
The damage only becomes visible when someone goes looking, by reading QUERY_HISTORY or by opening the monthly bill and asking what happened. By then the spend has already occurred. That lag between cause and discovery is the reason resource monitors exist: not as a dashboard to check occasionally, but as an active control that enforces a ceiling the platform was never going to enforce on its own.
Resource monitors and their four defining settings
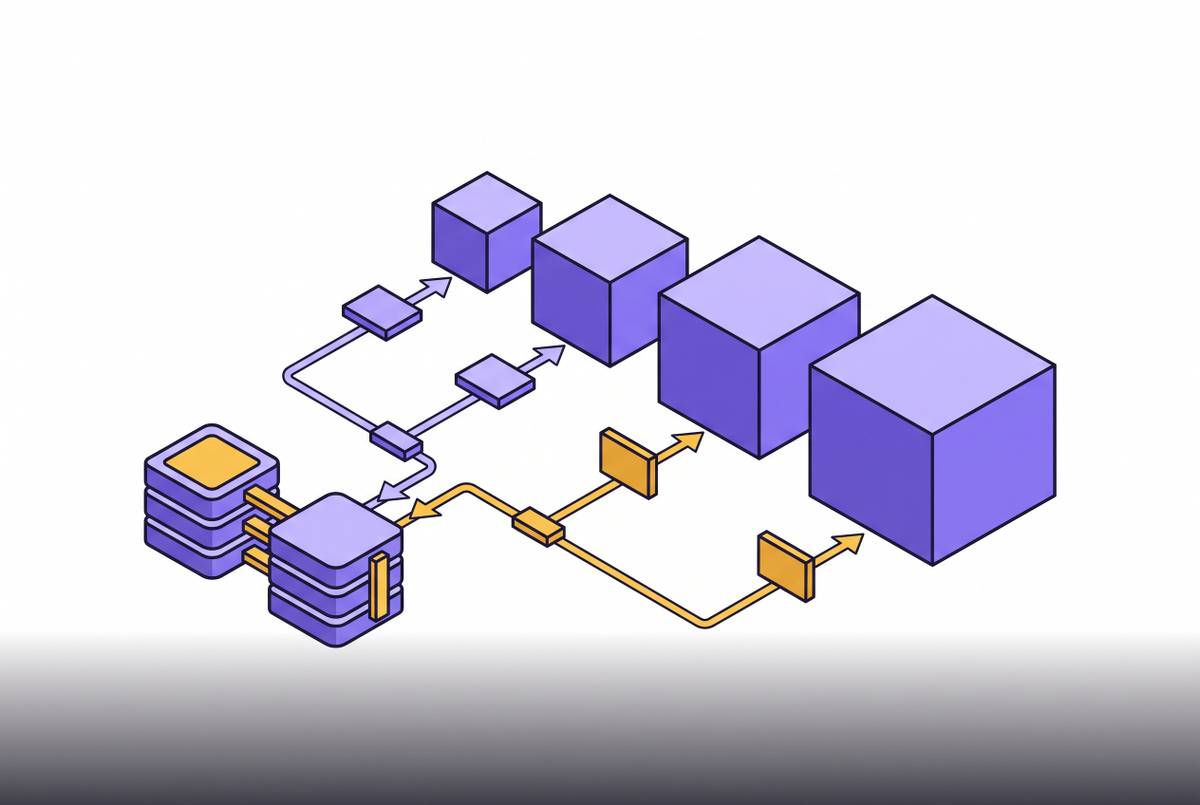
A resource monitor tracks credit consumption against a quota set by an administrator and carries out a predefined response once that consumption crosses a threshold. It can notify an administrator, suspend a warehouse so new queries stop while existing ones finish, or kill every running query on the spot. Four settings define every monitor, regardless of where it sits in an account.
The credit quota sets the ceiling: the number of credits allowed within one monitoring period. Frequency determines how often that quota resets, whether daily, weekly, monthly, yearly, or never. Thresholds mark the percentage points of the quota, such as an early warning level, a level close to the limit, and the ceiling itself, at which the monitor takes action. Actions define what happens at each of those thresholds.
The three available actions are not interchangeable, and choosing the wrong one for the wrong warehouse causes real operational damage. Notify-only sends an alert while queries continue, suiting an early warning threshold where the goal is awareness. Notify and Suspend stops new queries from starting but lets anything already running finish, so it's the right setting for budget limits on warehouses that support non-critical work. Notify and Suspend Immediately cancels every running query the moment the threshold is crossed, a hard kill that belongs on development and testing warehouses and has no place on production.
Monitors can be built two ways: through the Snowsight UI, under Admin, then Cost Management, then Resource Monitors, or through SQL with CREATE RESOURCE MONITOR. Snowsight handles basic setups fine. SQL gives administrators finer control and supports the kind of automation that matters once an account has dozens of warehouses to govern.
The two-tier architecture that separates a safety net from real budget ownership
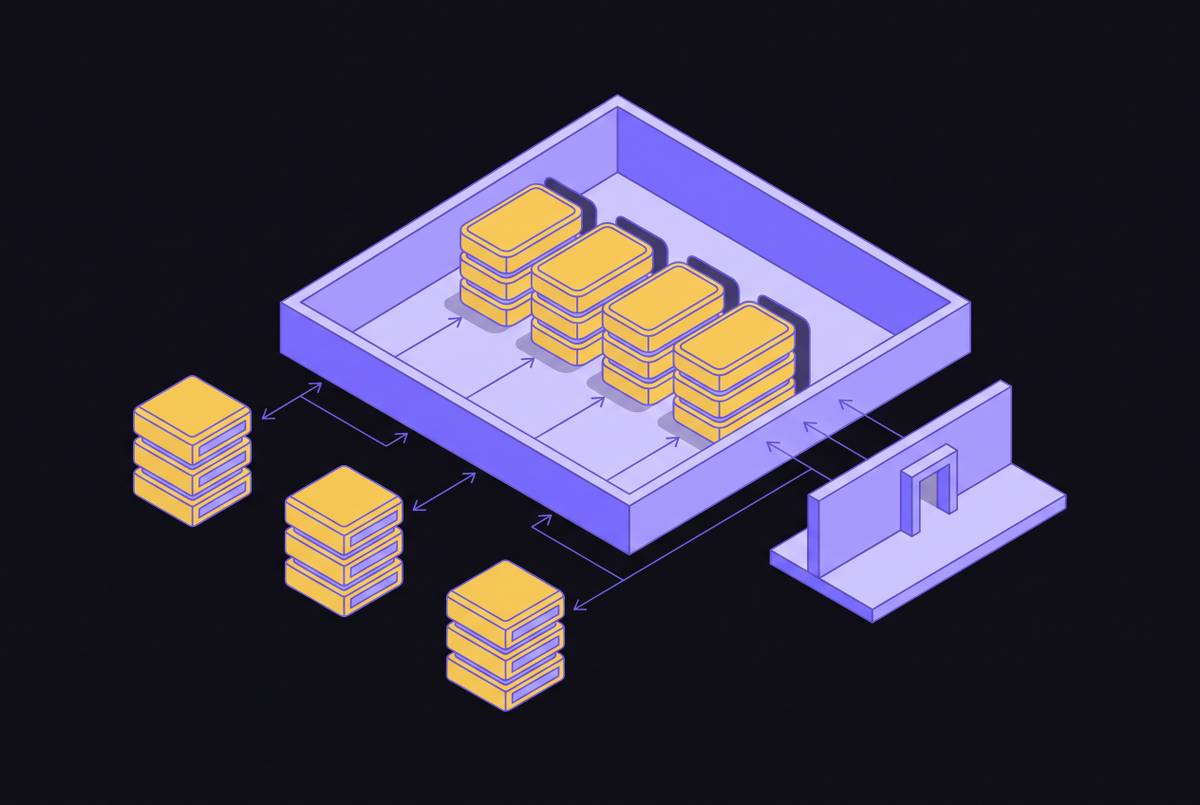
A single monitor at the account level is not a substitute for monitors at the warehouse level, and treating one as a replacement for the other leaves gaps on both ends. The account-level monitor is a last resort. Warehouse-level monitors are where budget ownership actually lives, team by team. Most enterprises need both tiers running at once, and conflating their roles leaves some teams over-exposed to runaway costs and others boxed in by limits that don't fit their actual workload.
An account-level monitor tracks aggregate compute spend across every warehouse in the account, so it functions as a global kill switch. When it hits its suspend threshold, every warehouse in the account stops, regardless of how much headroom any individual warehouse still had left in its own budget. Account-level monitors always take precedence over warehouse-level ones. That kind of blunt, account-wide stop carries real operational cost, so the quota behind it needs to represent a genuine ceiling for the whole organization, not a routine operating limit, and it rarely fires under normal conditions. Its weakness is diagnostic: when it does trigger, it cannot say which team or which warehouse drove the spike.
Warehouse-level monitors solve that problem by attaching to one or more specific warehouses, such as a marketing warehouse or a finance warehouse, each with its own quota. That structure creates real accountability. A data science team and a finance BI team don't run the same workloads or spend credits at the same rate, and a shared, undifferentiated limit would either starve one or let the other run unchecked. Per-warehouse monitors let each team own its own number. The tradeoff is maintenance: more warehouses means more monitors to configure and keep current as workloads shift.
The pattern that works in practice runs both tiers together, with the account-level monitor as the final backstop and warehouse-level monitors doing the daily governance work. If you set warehouse-level limits early, teams also get an early warning system after a migration or a major workload change, when credit consumption patterns are most likely to shift without anyone noticing right away.
Graduated thresholds and deliberate suspend actions: how to configure monitors that work in practice
A monitor that actually governs spend and one that either disrupts production or gets muted after the third false alarm differ in exactly two design choices: how its thresholds are graduated, and which suspend action sits behind each one. The governing principle is simple: notification thresholds need to fire well before any suspend action triggers at the quota ceiling, so a team has real time to respond instead of discovering the problem when queries start failing.
A production pattern used by ETL engineering teams illustrates this well. A per-team warehouse monitor is built with a defined monthly credit quota. An early threshold sends the first alert, well ahead of the limit, and a second alert fires as consumption gets closer to the ceiling. The hard suspend is set slightly above the quota itself so that critical jobs already in flight have room to complete. The monitor then attaches to the warehouse with a single statement:
ALTER WAREHOUSE loading_wh SET RESOURCE_MONITOR = etl_budget_monitor;A second pattern to build alongside fixed thresholds is anomaly detection: a monitor configured to alert when a day's spend exceeds a meaningful multiple of the warehouse's average daily consumption. The multiplier needs careful calibration. A multiplier set too low floods the team with alerts for normal variance; a multiplier set too high misses the spike it was built to catch.
Which action to assign depends heavily on what the warehouse is for. Production warehouses should run Notify and Suspend at every routine threshold, never Suspend Immediately, because if you kill in-flight queries on a production system, the failures cost far more than the credits you save. Development and testing warehouses carry the opposite logic: Suspend Immediately is a reasonable last-resort ceiling there, since no production query depends on them finishing. New monitor configurations deserve a trial run on a development warehouse before anyone rolls them out to production. In accounts with many warehouses to manage, SQL-based creation and assignment supports automating that rollout at scale rather than configuring each one by hand in Snowsight.
The serverless blind spot resource monitors cannot cover
Resource monitors govern one thing only: virtual warehouse compute. A substantial and growing share of Snowflake credit consumption happens entirely outside that scope, so if you build a governance plan on resource monitors alone, real spend stays ungoverned no matter how well you configure them. Snowpipe ingestion, serverless tasks, automatic clustering, materialized view maintenance, and the search optimization service all consume credits without ever touching a warehouse a resource monitor can see.
Snowflake Budgets close that gap. Budgets track spend broadly, reaching serverless features and AI services that resource monitors cannot see. The distinction that matters: Budgets are built primarily to alert, but through user-defined actions built on stored procedures, they can also suspend warehouses or take other automated steps once spending crosses a threshold, not only after the fact but based on projected spend expected to exceed a limit. Budgets also reach further on notifications than resource monitors do. Where a resource monitor can only notify by email or inside Snowsight, Budgets can deliver alerts to email, Amazon SNS, Azure Event Grid, Google Cloud Pub/Sub, and webhooks into Slack, Microsoft Teams, or PagerDuty.
The practical model: use Budgets for organization-wide visibility that includes serverless and AI spend, and use resource monitors to enforce hard limits on warehouse compute specifically. Neither tool replaces the other. Used together, they cover the account; used alone, either one leaves a real portion of spend outside its reach.
Closing the observability gap
A resource monitor enforces a limit, but it produces no explanation for why credits were consumed at the rate they were. A threshold notification tells a team it has spent half its quota. It says nothing about which query, which user, or which workload drove that number, and that gap is structural.
Monitoring and observability are distinct. A monitor firing at a set threshold tells a team that something is wrong. Tracing that spike back to a specific query, warehouse, or user pattern is a separate task, one that requires looking somewhere resource monitors don't reach. Two structural limits widen this gap further. Native resource monitor alerts only deliver by email or inside Snowsight, while most engineering teams run their actual incident response through Slack or Teams, creating a mismatch between where the alert lands and where the team works. Quotas themselves are also only as good as the usage history they're built on, often set from estimates rather than from measured patterns, and a monitor has no way to adjust itself when a workload changes shape.
The standard way to close that gap is to query QUERY_HISTORY, the view that records which warehouse, which user, and which query ran each statement, alongside WAREHOUSE_METERING_HISTORY, the authoritative record of credit consumption by warehouse. Together they allow a reasonably precise attribution of spend back to a specific warehouse, user, or query. That's why reading QUERY_HISTORY and exercising real judgment about credit cost counts as a core competency for Snowflake administrators and engineers, not a specialized skill reserved for a few people on a platform team. Query tagging, set with ALTER SESSION SET QUERY_TAG, adds the context QUERY_HISTORY needs to attribute spend to a specific team, dashboard, or pipeline. It's a small habit to build into pipeline code, and it makes investigating a threshold breach after the fact a tractable exercise grounded in evidence. Teams that want continuous anomaly detection and root-cause attribution without running that investigation manually each time can extend native tooling with third-party observability platforms built for this purpose, which flag spend deviations, attribute them to specific workloads, and in some cases recommend or automate the fix.
Who owns resource monitor configuration
Resource monitor configuration works as an ongoing governance discipline, not a box checked once during account setup. The teams that treat it that way are the ones who find out about a cost problem from an alert, not from the bill.
Access to that discipline doesn't require full administrative control of the account. Account administrators can grant MONITOR and MODIFY privileges to other roles, so team leads can view and adjust the monitors covering their own warehouses without holding ACCOUNTADMIN. That delegation is how larger organizations give individual teams real visibility into their own spend without handing out account-wide control to everyone who needs to see a number.
In practice, the ongoing design and maintenance of resource monitors sits with Snowflake administrators and architects rather than with data engineers or analytics engineers, because the job calls for judgment about account topology, RBAC design, and credit-cost tradeoffs, not for skill writing SQL. But the line between those roles blurs in the moment that matters most: the engineer who reads QUERY_HISTORY, traces a runaway warehouse back to its cause, fixes the clustering keys driving the cost, and adds the resource monitor that should have existed from day one is performing exactly the administrator function the role demands. That capability is often underweighted in hiring processes built around SQL syntax tests, even though it's the skill that actually prevents the next overrun.
Resource monitors as one layer in a complete cost-governance stack
Resource monitors enforce a spending limit but do nothing to reduce the credit consumption driving that spend. Real cost optimization needs hard caps paired with warehouse rightsizing, query optimization, and FinOps practices aimed at the root causes of overconsumption, not just the mechanism that stops the bleeding once a threshold is crossed.
A complete governance stack layers several practices that each do different work. Resource monitors give you hard, warehouse-level credit caps with notification thresholds set in graduated stages. Snowflake Budgets extend that visibility to serverless features and AI services across the whole account. If teams read QUERY_HISTORY alongside consistent query tagging, they get the attribution they need to trace a spike back to its source. Warehouse rightsizing, matching warehouse size to the workload actually running on it rather than defaulting to oversized compute, reduces consumption before any monitor ever needs to fire. Auto-suspend settings tuned to real usage patterns, rather than left at whatever the platform defaults to, cut idle spend that would otherwise run unnoticed. Zero-copy cloning keeps development and test workloads off production-scale compute entirely, so it removes a whole category of waste before it starts.
The teams that keep control of their compute costs are the ones that build this governance in from the start, as a designed feature of how they run Snowflake, rather than a set of controls bolted on after the first bill makes the cost of skipping it clear.